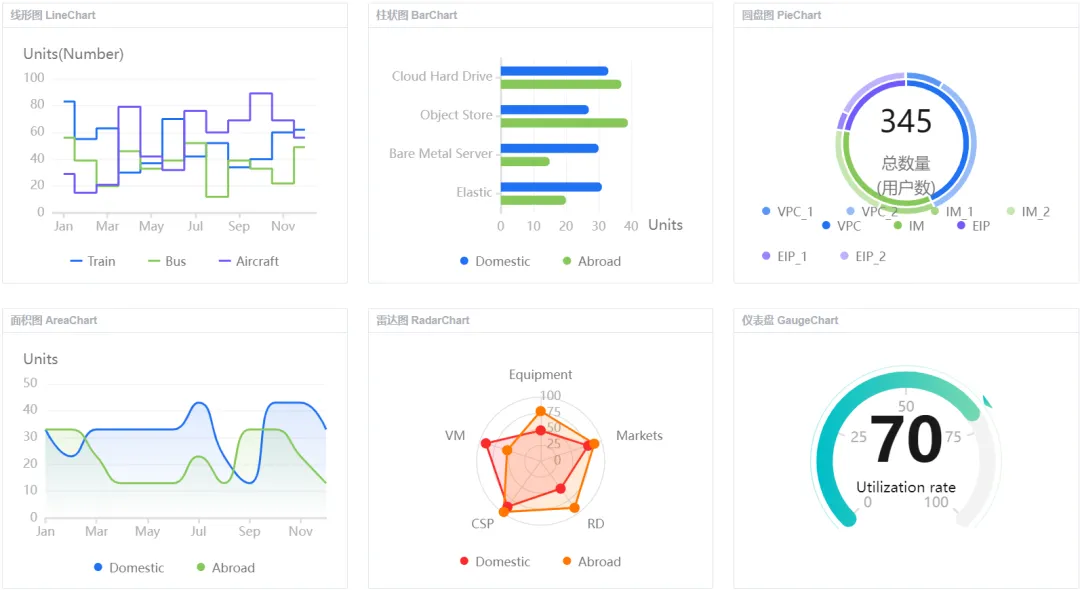
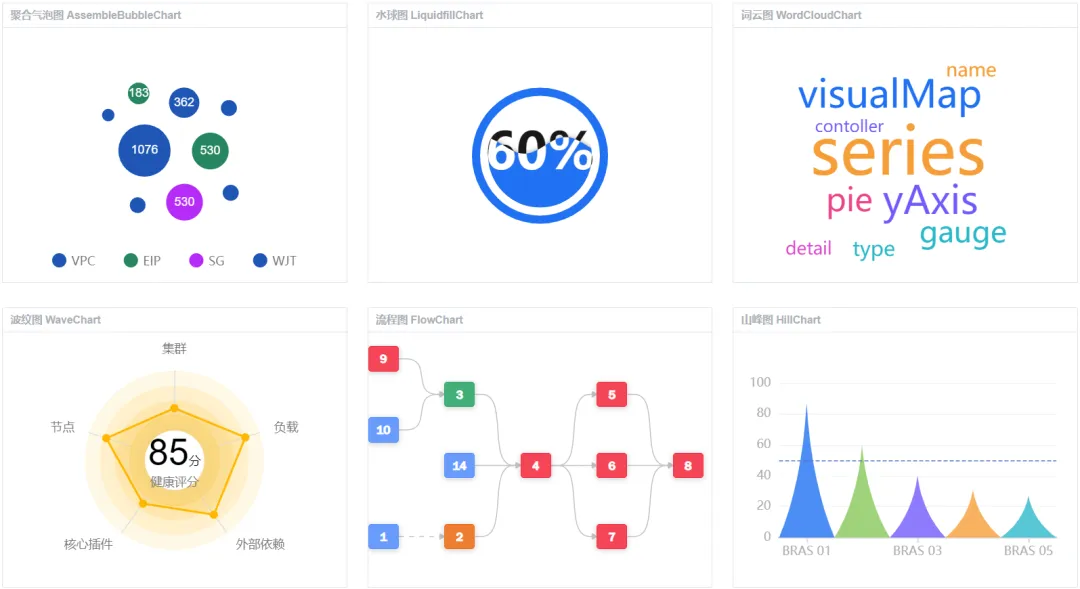
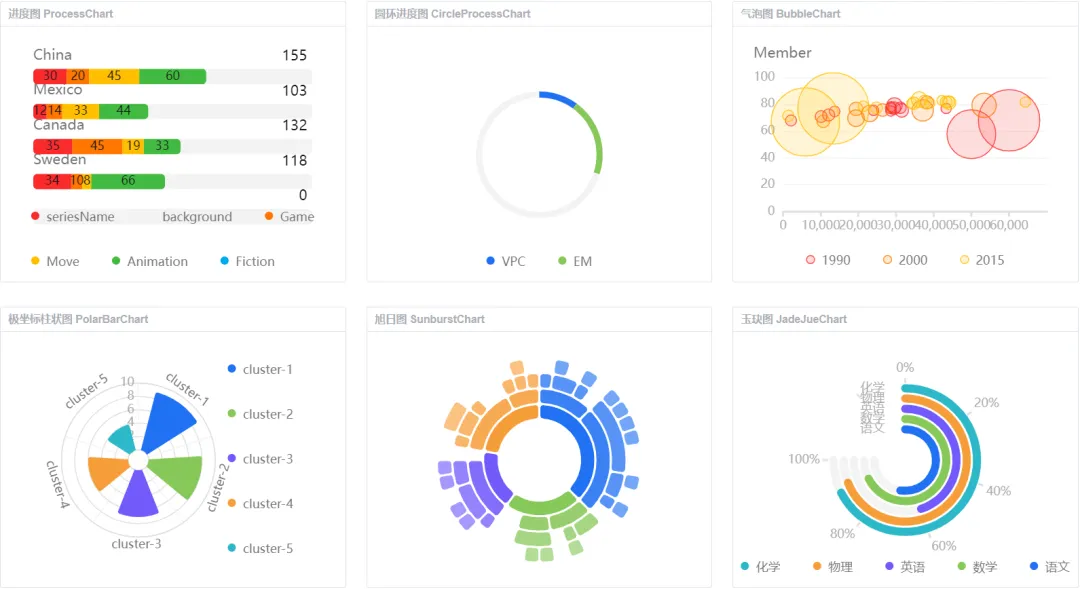
OpenTiny HUICharts 是一个数据可视化图表库,旨在为用户提供丰富的图表类型和灵活的配置选项,以便更好的展示和分析数据。
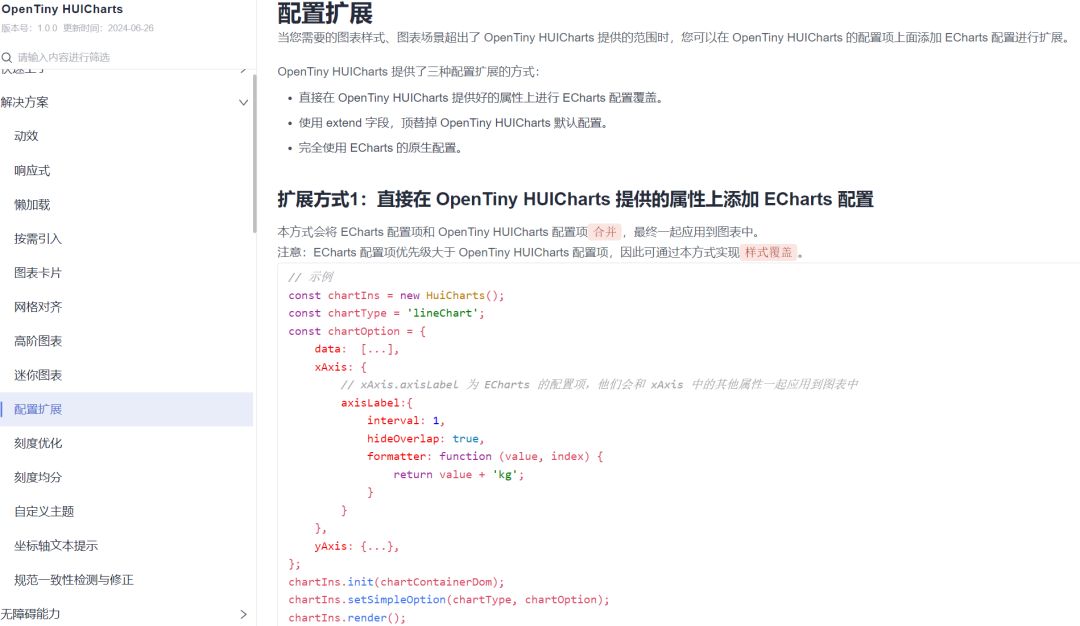
- 支持基础图表类型:
- 线形图、面积图、柱状图、圆盘图、雷达图、仪表盘、进度图、圆环进度图、气泡图、热力图、散点图、子弹图、极坐标柱状图、旭日图、箱形图、山峰图、桑基图、区域图、漏斗图、水球图、树图、矩形树图、关系图、聚合树图、聚合气泡图、词云图、玉玦图、K 线图。
- 支持高阶图表类型:
- 甘特图、流程图、河流图、蜂窝图、波纹图、梯田图、时间轴、组织关系图、雪花图、里程碑图。
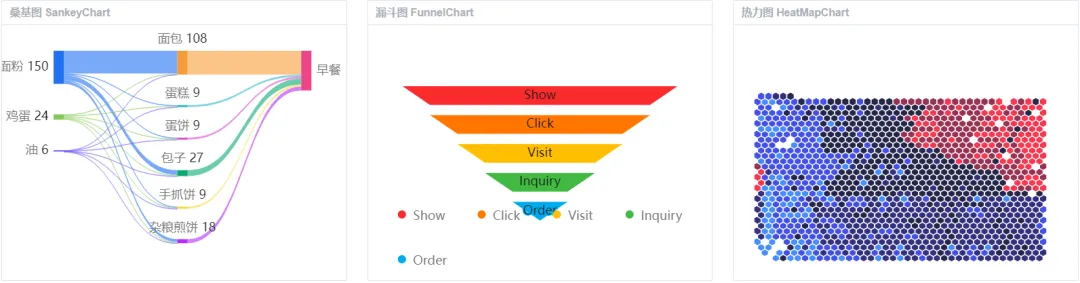
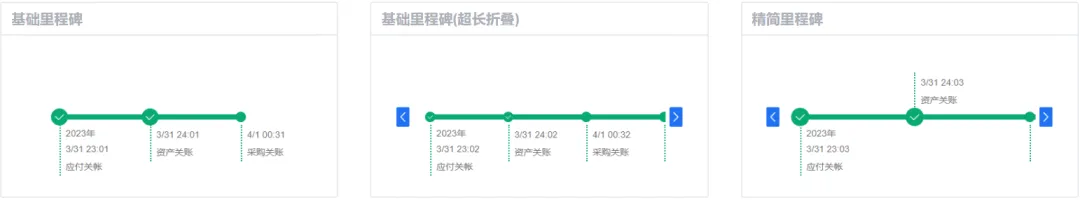
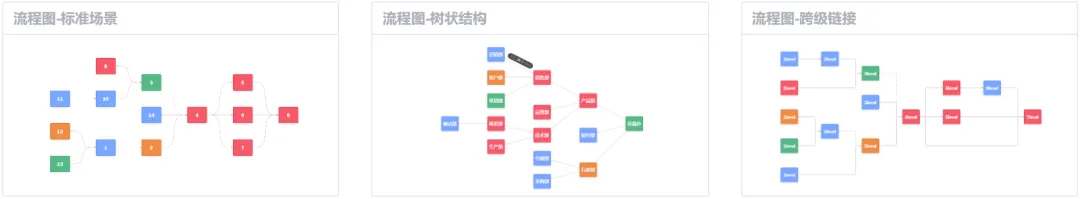
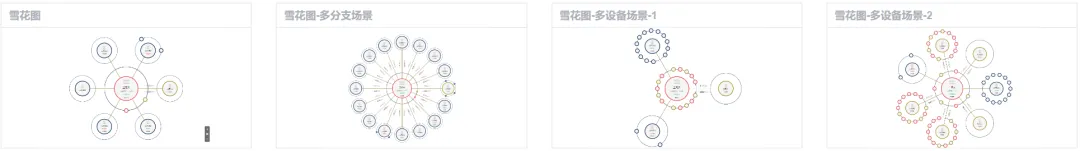
图表类型展示:
# 组件库安装:
// 查看版本 | |
npm show @opentiny/huicharts | |
// 安装 | |
npm install @opentiny/huicharts@latest --save |
图表组件使用:
// 引用图表库 | |
import HuiCharts from '@opentiny/huicharts'; | |
// 创建图表容器 | |
<div id="main" style="width: 500px;height:350px;"></div> | |
// 创建图表实例 | |
let chartIns = new HuiCharts(); | |
// 初始化图表容器 | |
let chartContainerDom = document.getElementById('main'); | |
chartIns.init(chartContainerDom); | |
// 填入图表配置项 | |
let chartOption = { | |
theme: 'hdesign-light', | |
padding: [50, 30, 50, 20], | |
legend: { | |
show: true, | |
icon: 'line' | |
}, | |
data: [ | |
{ 'Month': 'Jan', 'Domestics': 133, 'Abroad': 137 }, | |
{ 'Month': 'Feb', 'Domestics': 127, 'Abroad': 139 }, | |
{ 'Month': 'Mar', 'Domestics': 131, 'Abroad': 120 }, | |
{ 'Month': 'Apr', 'Domestics': 130, 'Abroad': 115 }, | |
{ 'Month': 'May', 'Domestics': 137, 'Abroad': 113 }, | |
{ 'Month': 'Jun', 'Domestics': 136, 'Abroad': 117 }, | |
{ 'Month': 'Jul', 'Domestics': 142, 'Abroad': 122 }, | |
{ 'Month': 'Aug', 'Domestics': 122, 'Abroad': 112 }, | |
{ 'Month': 'Sep', 'Domestics': 117, 'Abroad': 130 }, | |
{ 'Month': 'Oct', 'Domestics': 140, 'Abroad': 133 }, | |
{ 'Month': 'Nov', 'Domestics': 142, 'Abroad': 122 }, | |
{ 'Month': 'Dec', 'Domestics': 132, 'Abroad': 111 } | |
], | |
xAxis: { | |
data: 'Month', | |
}, | |
yAxis: { | |
name: 'Percentage(%)' | |
} | |
}; | |
// 指定使用图表类型:LineChart、AreaChart、BarChart、PieChart、GaugeChart、RadarChart、ProcessChart、BubbleChart 等 | |
// 图表类型的英文名称可以在文档左侧菜单栏看到 | |
let chartType = 'LineChart'; | |
chartIns.setSimpleOption(chartType, chartOption); | |
// 开始渲染 | |
chartIns.render(); |
功能和特性:
- 丰富的图表类型:支持 40+ 种数据可视化图表类型,如折线图、柱状图、饼图、散点图、地图等。
- 灵活的配置:用户可以根据自己的需求,灵活地配置图表的样式、颜色、数据等。
- 易于集成:支持多种编程语言和框架,可以轻松集成到现有的 Web 项目中。
- 响应式设计:图表支持响应式布局,确保在不同设备和屏幕尺寸上都能良好展示。
- 交互性:图表支持交互操作,如工具提示、数据缩放、图例控制等。
- 自定义组件:支持自定义图表组件,以适应特定的业务需求。