# 工具
# Lighthouse
lighthouse 是一个用于诊断网页的工具,包括 性能、无障碍、渐进式、SEO 等方面,通过得分的方式来报告网页的质量。
使用方法:
- Dev Tools : 直接在 Dev Tools 中 lighthouse panel 勾选 Mode 、 Device 、Categories 之后点击 Analyze page load 即可
- lighthouse 扩展程序
- npm 包
npm install -g lighthouse | |
lighthouse <url> |
- PageSpeed Insights : pagespeed.web.dev
# Performance Panel
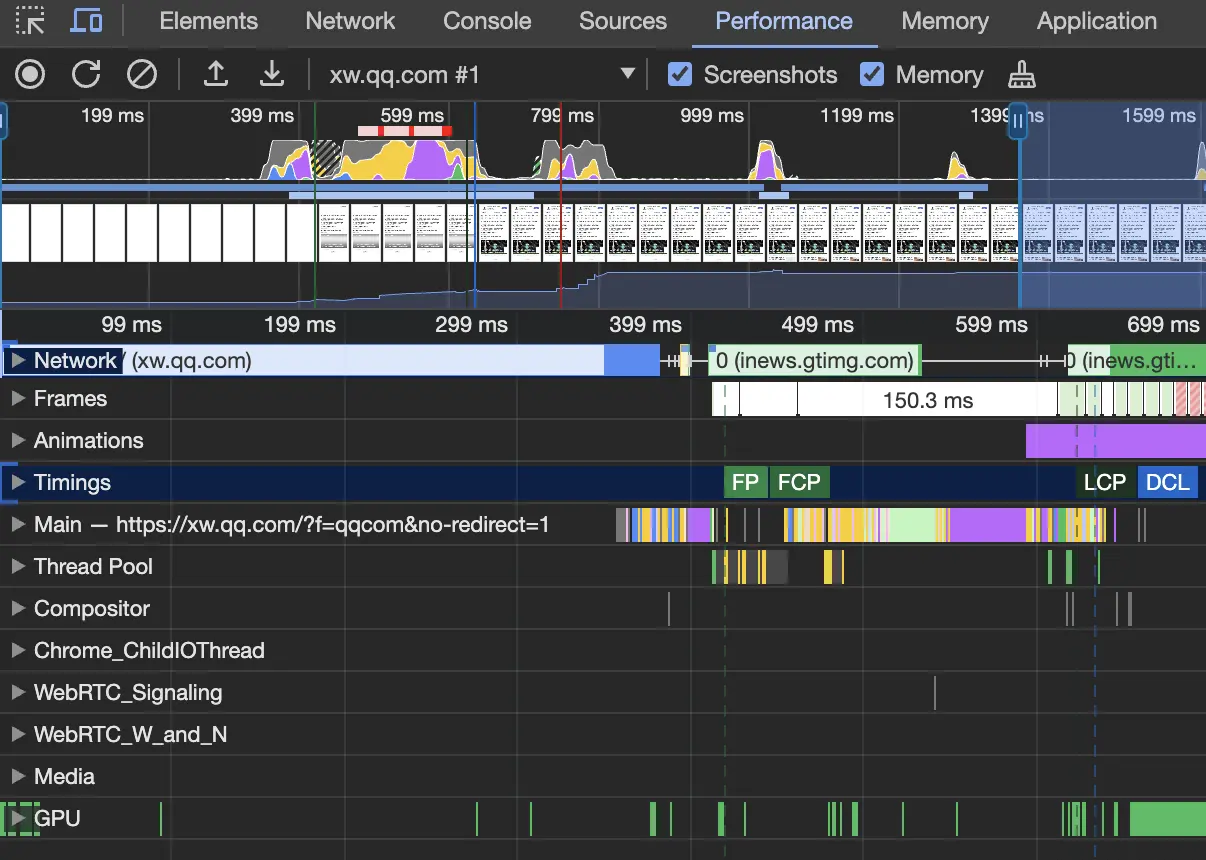
chrome Dev Tools 中的 Performance panel 是一个专门检测性能的面板。里面有非常详细的数据,可以查看到性能相关的各个方面的数据
访问 xw.qq.com 之后,通过 Performance 面板跑的数据:如下
 ]
]
最上面是 CPU , heap 数据, 下面是其他的指标
- Network : 可以看到资源的加载顺序以及其耗时
- Frames : 页面帧变化截图
- Main : 程序主进程(重要),可以用于分析 长任务
- Timings: DCL (DocumentContentLoad event) FCP LCP 等指标
# Performance Api
Performance Api 是一组用于衡量 web 应用性能的标准。 包含了 DOM 加载,渲染, 其他的资源加载过程 等指标,还可以自定义指标。
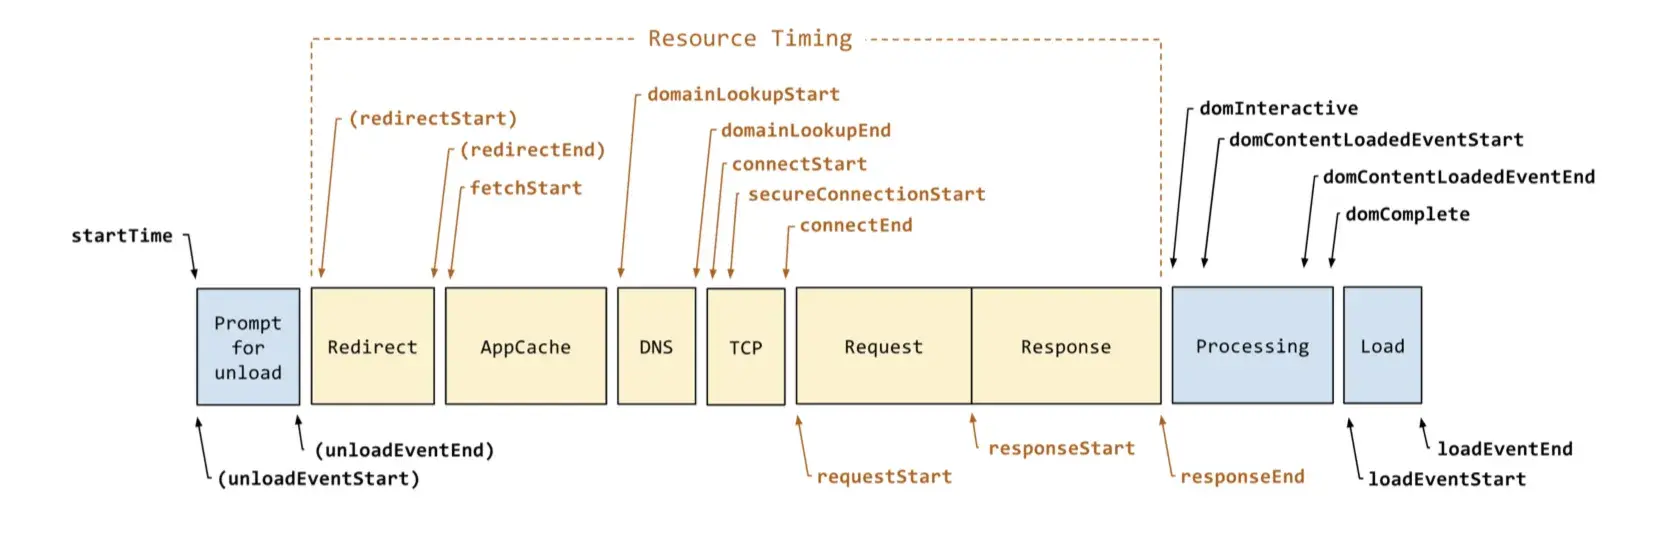
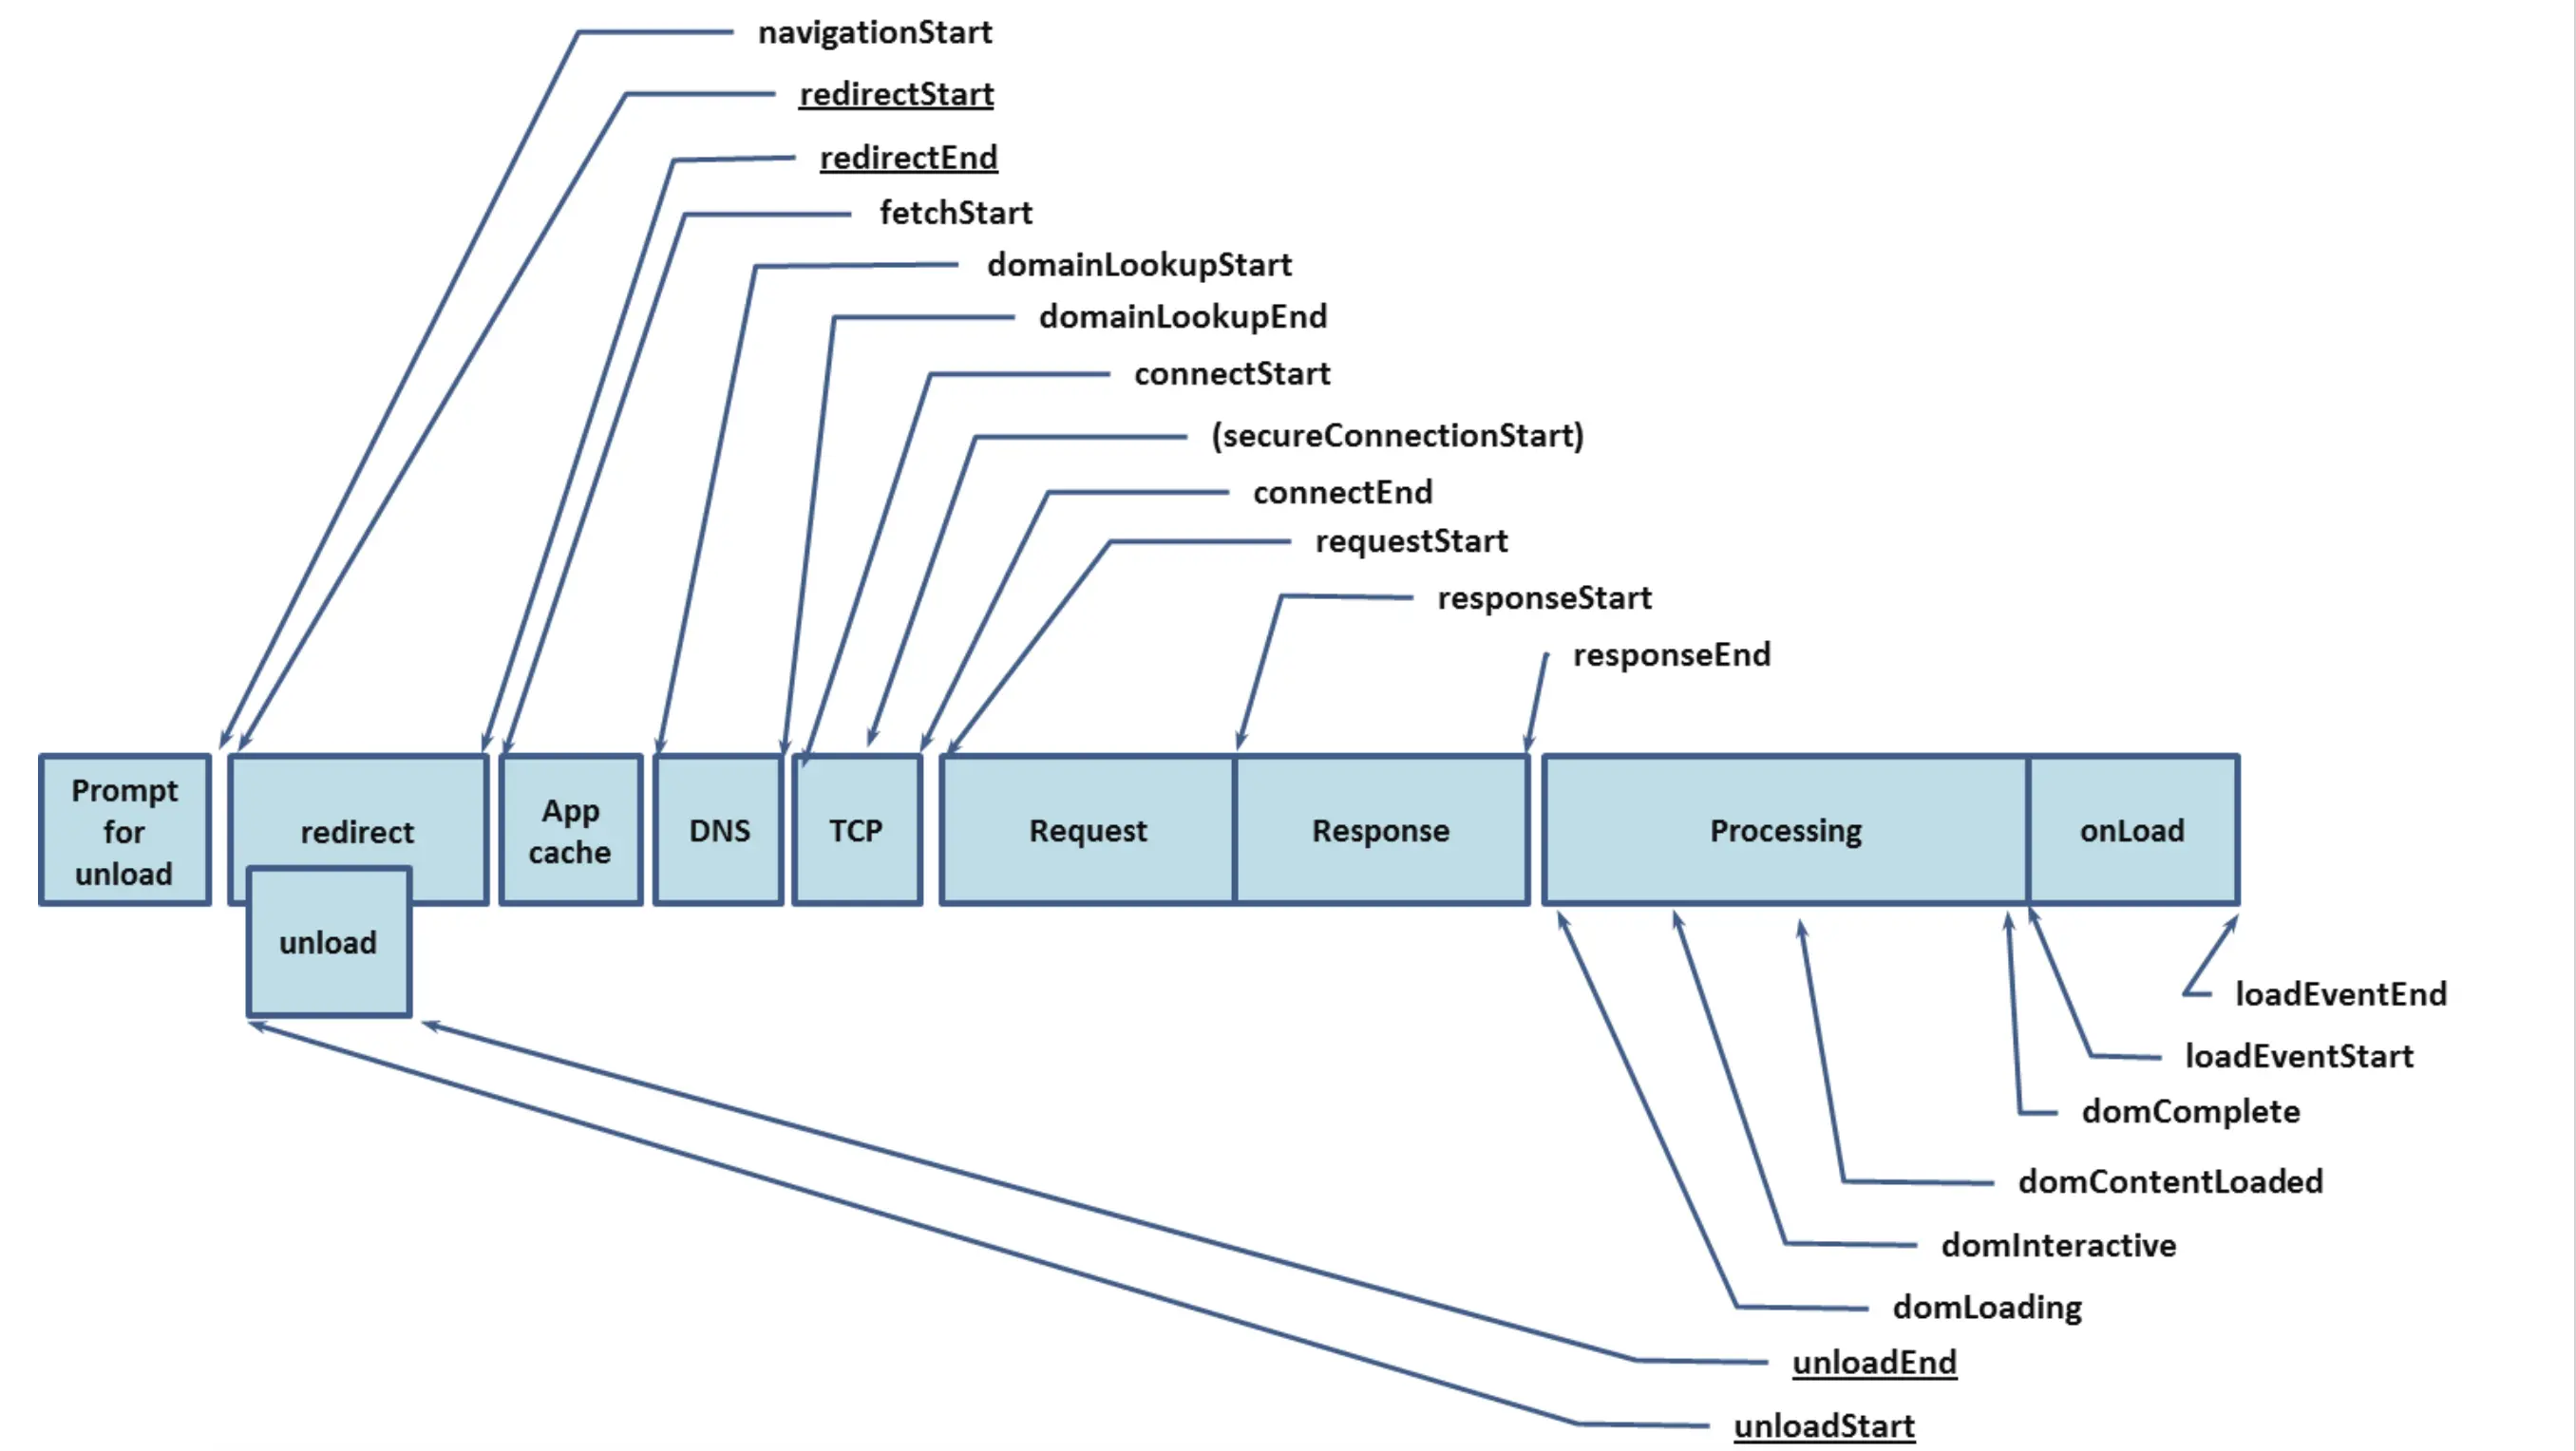
页面加载的过程分为多个阶段,如下
window.performance.timing: | |
{ | |
"connectStart": 1711121440358, | |
"navigationStart": 1711121440354, | |
"secureConnectionStart": 0, | |
"fetchStart": 1711121440358, | |
"domContentLoadedEventStart": 1711121440526, | |
"responseStart": 1711121440422, | |
"domInteractive": 1711121440526, | |
"domainLookupEnd": 1711121440358, | |
"responseEnd": 1711121440428, | |
"redirectStart": 0, | |
"requestStart": 1711121440365, | |
"unloadEventEnd": 1711121440425, | |
"unloadEventStart": 1711121440425, | |
"domLoading": 1711121440427, | |
"domComplete": 1711121440592, | |
"domainLookupStart": 1711121440358, | |
"loadEventStart": 1711121440592, | |
"domContentLoadedEventEnd": 1711121440526, | |
"loadEventEnd": 1711121440594, | |
"redirectEnd": 0, | |
"connectEnd": 1711121440358 | |
} |
页面加载完了, window.performance.timing 对下中会包含上图阶段对应的时间戳值,我们可以通过某些值的计算得出一些指标数据,如白屏时间,首屏时间等。
performance.getEntries() 包含了在页面加载过程中检测到所有指标, 包含资源加载, FP FCP 等多个指标。 可以通过过滤 entryType 来分析具体的指标数据。
VisibilityStateEntry {name: 'visible', entryType: 'visibility-state', startTime: 0, duration: 0} | |
PerformanceResourceTiming {initiatorType: 'link', nextHopProtocol: '', deliveryType: '', workerStart: 0, redirectStart: 0, …} | |
PerformanceResourceTiming {initiatorType: 'link', nextHopProtocol: '', deliveryType: '', workerStart: 0, redirectStart: 0, …} | |
PerformanceResourceTiming {initiatorType: 'link', nextHopProtocol: '', deliveryType: '', workerStart: 0, redirectStart: 0, …} | |
PerformanceResourceTiming {initiatorType: 'script', nextHopProtocol: 'h2', deliveryType: '', workerStart: 0, redirectStart: 0, …} | |
PerformanceResourceTiming {initiatorType: 'script', nextHopProtocol: 'h2', deliveryType: '', workerStart: 0, redirectStart: 0, …} | |
PerformanceResourceTiming {initiatorType: 'link', nextHopProtocol: '', deliveryType: '', workerStart: 0, redirectStart: 0, …} | |
PerformanceResourceTiming {initiatorType: 'link', nextHopProtocol: '', deliveryType: '', workerStart: 0, redirectStart: 0, …} | |
PerformanceResourceTiming {initiatorType: 'link', nextHopProtocol: '', deliveryType: '', workerStart: 0, redirectStart: 0, …} | |
PerformanceResourceTiming {initiatorType: 'script', nextHopProtocol: '', deliveryType: '', workerStart: 0, redirectStart: 0, …} | |
PerformanceResourceTiming {initiatorType: 'img', nextHopProtocol: '', deliveryType: '', workerStart: 0, redirectStart: 0, …} | |
PerformanceResourceTiming {initiatorType: 'img', nextHopProtocol: '', deliveryType: '', workerStart: 0, redirectStart: 0, …} | |
PerformanceResourceTiming {initiatorType: 'css', nextHopProtocol: '', deliveryType: '', workerStart: 0, redirectStart: 0, …} | |
PerformanceResourceTiming {initiatorType: 'css', nextHopProtocol: '', deliveryType: '', workerStart: 0, redirectStart: 0, …} | |
PerformanceResourceTiming {initiatorType: 'css', nextHopProtocol: '', deliveryType: '', workerStart: 0, redirectStart: 0, …} | |
PerformancePaintTiming {name: 'first-paint', entryType: 'paint', startTime: 2446.5999999940395, duration: 0} | |
PerformancePaintTiming {name: 'first-contentful-paint', entryType: 'paint', startTime: 2446.5999999940395, duration: 0} | |
PerformanceResourceTiming {initiatorType: 'iframe', nextHopProtocol: '', deliveryType: '', workerStart: 0, redirectStart: 0, …} | |
PerformanceResourceTiming {initiatorType: 'other', nextHopProtocol: 'h2', deliveryType: 'cache', workerStart: 0, redirectStart: 0, …} |
# 关键指标
# FPS : 页面刷新帧率
页面卡顿?判断页面是否卡顿,就是计算页面 FPS , 60 左右是一个比较优的帧率,就是大约 16.5ms 刷新一次页面。
如何计算 FPS ? requestAnimationFrame 是跟随着帧率执行代码,计算 1 秒 执行的次数就可以计算出帧率
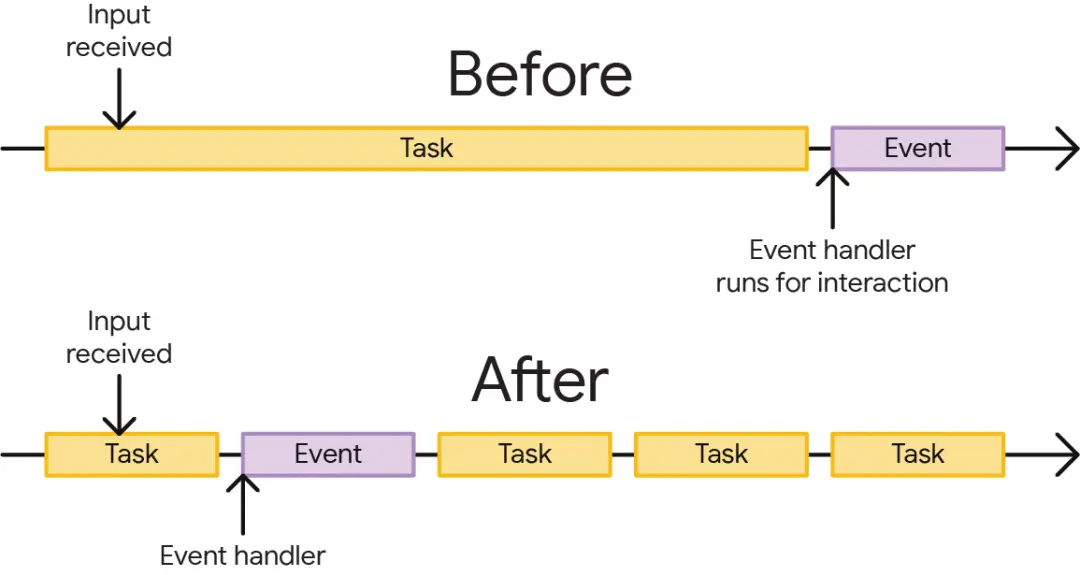
如何减少卡顿?减少卡顿就是避免长时间占用主进程,给予刷新页面留时间。由于 JS 的执行是单线程,如果长时间占用主线程,那么刷新页面,响应用户,就会滞后,进而导致卡顿。 解决方案:就是长任务拆解,将长任务拆解成多个短任务,将短任务分别置于任务循环中,在下个任务循环时执行。那么主线程就用空档来刷新页面,响应用户。
如何分析?
实际过程中可以用 Chrome Dev Tool 的 Performance Panel 中的 Main 来分析长任务。
也可以通过 performance.getEntries() 过滤 entryType = 'longtask' 来分析
# 白屏时间 & 首屏时间
- 白屏时间: 请求页面到开始渲染时间,可以用 performance Api
const whiteScreenTime = performance.timing.responseStart - performance.timing.navigationStart; |
- 首屏时间: 完全渲染第一屏的时间,第一屏会根据具体业务变化而变化,这里不是个固定值。一般可以有下面几种方式
- DCL : domcumentContentLoad 事件触发时间
performance.timing.domContentLoadedEventEnd - LCP : FCP 是首次绘制的时间, LCP (largest-contentful-paint) 可以更准备的描述首屏时间
- 监控节点高度: 使用 MutationObserver 来监听节点,如果节点的高度与大屏幕高度,则表示首屏已经渲染。
- DCL : domcumentContentLoad 事件触发时间